Skip to content

September 2024

Devops container

Containers: Solving the "It Works on My Machine" Problem

Have you ever built an app that ran perfectly on your machine, only to see it crash and burn on someone else’s? That’s the classic “It works on my machine” problem. Containers solve this by packaging everything your app needs—code, libraries, tools, and settings—so it behaves the same no matter where it's run.

The Big Idea: Bundle Every Dependency

At the heart of containers is the idea of shipping all dependencies with your app. This isolates it from the host system and other apps, eliminating conflicts and surprises.

But Containers Aren’t Magic

They feel magical, but they’re not. Containers are just regular Linux processes, given superpowers by kernel features.

Containers = Processes

A container is just a process with some isolation. The Linux kernel makes this happen.

Key Kernel Features

  • cgroups (control groups): limit and isolate resource usage (CPU, memory, etc.)
  • namespaces: isolate things like process trees, users, network interfaces, and filesystems

Diving Deeper

  • pivot_root: changes the root filesystem of a process
  • layers: containers are built from stacked image layers, saving space and time
  • overlay filesystems: combine multiple layers into one coherent view
  • container registries: store and distribute container images (like Docker Hub)

The Power of Isolation

  • cgroups control resource limits
  • namespaces isolate environments:
  • PID, user, network, and mount namespaces create that sandboxed feeling
  • how to make a namespace: tools like unshare or clone() can do it

Networking & Security

  • container IP addresses: every container can get its own IP
  • capabilities: fine-grained control over what a process can do
  • seccomp-BPF: filter syscalls for tighter security

Flexibility Through Config

  • configuration options: containers are highly customizable through runtime configs

Github Actions: Automate Your Way to Success in Development

The problem

In today’s fast-paced software development world, teams are constantly under pressure to deliver high-quality applications quickly. However, as applications grow in complexity, manual processes often become a bottleneck, leading to errors, delays, and inconsistent releases. This is where DevOps practices come into play, offering solutions to streamline and automate these processes.

Let’s split the problem into two distinct but intertwined realms: Continuous Integration (CI) and Continuous Deployment (CD). These practices are designed to help development teams avoid common pitfalls and improve the speed and reliability of software delivery.

Continuous Integration (CI)

Humans are prone to errors: we forget dependencies, make linting mistakes, and work with complex systems that have interdependencies—especially in large teams. These mistakes can lead to technical debt, production bugs, and negative impacts on end users, which is the last thing any developer wants.

Continuous Deployment (CD)

With CD, the challenge is automating software updates. In a typical CD process, code is automatically built, tested, and then deployed. Manual intervention introduces risk, slows things down, and leaves room for mistakes. Automating the deployment pipeline ensures faster and more reliable software delivery.

Cast of characters

Workflows

A workflow is a configurable automated process consisting of one or more jobs. These workflows are defined in .github/workflows and can be triggered by a variety of events. Common workflows include:

  • Building and testing pull requests.
  • Deploying applications after a release.
  • Automatically adding labels to new issues.

Events

Events are activities in a repository that trigger workflows. Examples include:

  • Pushing code.
  • Opening a pull request.
  • Creating a new issue.
  • Workflows can also be triggered manually or on a predefined schedule. For a full list, see GitHub’s documentation on Events that trigger workflows.

Jobs

A job is a collection of steps executed on the same runner. Each step can either be a shell script or an action that is part of the workflow. Steps are executed in order, and you can share data between them.

Jobs run in parallel unless configured otherwise, meaning independent jobs can speed up processes. For example, you can have parallel build jobs for different architectures followed by a packaging job that only starts after all builds finish successfully.

Actions

An action is a reusable application that performs specific tasks. Actions help reduce repetitive code in workflows. Common actions include:

  • Pulling your Git repository.
  • Setting up toolchains for building.
  • Authenticating with cloud providers.

You can write custom actions or use those available in the GitHub Marketplace.

Runners

A runner is a server that executes your workflows. GitHub provides runners for Ubuntu, Windows, and macOS, which run in isolated virtual machines.

You also have the option to host your own runner if you need a specific OS or hardware configuration.

Example of Usage

Here's an example of a pipeline configuration for deploying a static website using GitHub Actions. This pipeline includes a workflow that automates the deployment process whenever code is pushed to the main or master branch.

The workflow is triggered by two specific events: a push to the main or master branch. When triggered, the pipeline runs a job with several steps, each using actions to configure credentials, fetch the code, install dependencies, and deploy the website.

#.github/workflows/action.yml
name: CD
on:
  push:
    branches:
      - master
      - main
permissions:
  contents: write
jobs:
  deploy:
    runs-on: ubuntu-latest
    steps:
      - uses: actions/checkout@v4
      - name: Configure Git Credentials
        run: |
          git config user.name <cool_action_name>
          git config user.email <cool_action_email>
      - uses: actions/setup-python@v5
        with:
          python-version: 3.x
      - run: echo "cache_id=$(date --utc '+%V')" >> $GITHUB_ENV
      - uses: actions/cache@v4
        with:
          key: mkdocs-material-${{ env.cache_id }}
          path: .cache
          restore-keys: |
            mkdocs-material-
      - run: pip install mkdocs-material[imaging] && pip install mkdocs-material
      - run: mkdocs gh-deploy --force

For more examples and detailed information, check the GitHub Actions Documentation.

Conclusion

This post aimed to introduce the basics of CI/CD and demonstrate how it can streamline your development process. By automating workflows like the one shown above, you can improve the speed and reliability of your deployments. CI/CD isn't just for large teams—it's a valuable tool for developers of all sizes and stages to enhance code quality and simplify deployment :).

trivy Automating Security Scanning Applied to Terraform Resources

Introduction

Security is a vital concern when managing infrastructure, and it’s critical to identify vulnerabilities in both container images and infrastructure-as-code (IaC). While Terraform helps automate the deployment of cloud resources, combining it with security tools like trivy ensures that any configuration or resource vulnerabilities are caught early.

In this post, we will walk through how to integrate trivy into your Terraform workflow to automate security scanning of the resources you define. We will cover setting up trivy, running scans, and interpreting the results, ensuring your Terraform-managed infrastructure is as secure as possible.

Use case

It’s important to recognize that Trivy is a versatile security tool capable of scanning a wide range of resources, including container images, file systems, and repositories. However, in this post, we will focus specifically on scanning Infrastructure as Code (IaC) through Terraform configuration, utilizing Trivy’s misconfiguration scanning mode.

The Terraform configuration scanning feature is accessible through the trivy config command. This command performs a comprehensive scan of all configuration files within a directory to detect any misconfiguration issues, ensuring your infrastructure is secure from the start. You can explore more details on misconfiguration scans within the Trivy documentation, but here we’ll focus on two primary methods: scanning Terraform plans and direct configuration files.

Method 1: Scanning with a Terraform Plan

The first method involves generating a Terraform plan and scanning it for misconfigurations. This allows Trivy to assess the planned infrastructure changes before they are applied, giving you the opportunity to catch issues early.

cd $DESIRED_PATH
terraform plan --out tfplan
trivy config tfplan
  • The terraform plan --out tfplan command creates a serialized Terraform plan file.
  • trivy config tfplan then scans this plan for any potential security risks, providing insights before applying the configuration.

Method 2: Scanning Configuration Files Directly

Alternatively, you can scan the Terraform configuration files directly without generating a plan. This is useful when you want to perform quick checks on your existing code or infrastructure definitions.

cd $DESIRED_PATH
trivy config ./ 

This command instructs Trivy to recursively scan all Terraform files in the specified directory, reporting any misconfigurations found.

Trivy installation

For installation instructions please refer to the oficial documentation

See it in action

Automating the Scans in a CI/CD Pipeline

A good strategy is integrating trivy scans into your CI/CD pipeline. As an example we can expose it through github Actions, the official action can be found here,but as an easy alternative this pipe can be definied:

# GitHub Actions YAML file
name: Terraform Security Scanning

on: [push]

jobs:
  scan:
    runs-on: ubuntu-latest
    steps:
    - name: Checkout repository
      uses: actions/checkout@v2

    - name: Install trivy
      run: |
        curl -sfL https://raw.githubusercontent.com/aquasecurity/trivy/main/contrib/install.sh | sudo sh

    - name: Run trivy scan
      run: trivy config --severity HIGH,CRITICAL --exit-code 1 .

Conclusion

Summarize the importance of security scanning in the Terraform workflow and how using trivy automates this process. Encourage readers to integrate scanning tools into their infrastructure deployments for proactive vulnerability management.

Introduction to Powertools for AWS Lambda

Building serverless applications with AWS Lambda offers scalability, cost-efficiency, and reduced operational overhead. However, as these applications grow, so do the challenges.

Have you struggled to pinpoint why a Lambda function slowed down or why your app returns intermittent errors? Debugging cryptic logs or understanding service interactions across distributed systems can be time-consuming and frustrating.

These challenges lead to:

  • Unhappy customers due to downtime or poor performance.
  • Wasted developer hours troubleshooting avoidable issues.
  • Critical visibility gaps that hinder optimization and troubleshooting.

In a serverless environment, traditional monitoring methods fall short. You need tools designed for the serverless world.

What Are Lambda Python Powertools?

AWS Lambda Powertools for Python is an open-source library provided by AWS that simplifies and enhances the development of serverless applications written in Python. It is a collection of utilities designed to follow best practices and streamline tasks such as logging, tracing, metrics collection, and configuration management in AWS Lambda.


Core Features

  1. Logging:
  2. Provides opinionated, structured JSON logging out of the box.
  3. Automatically captures contextual information, such as Lambda function name, version, and AWS request ID.
  4. Logs can include custom metadata, making them easier to analyze in tools like CloudWatch, Elasticsearch, or Splunk.

Example:

from aws_lambda_powertools.logging import Logger

logger = Logger()
logger.info("This is a structured log", extra={"user_id": "12345"})

Output:

{
    "level": "INFO",
    "timestamp": "2024-11-22T10:00:00Z",
    "message": "This is a structured log",
    "user_id": "12345",
    "function_name": "my-function"
}
  1. Metrics:
  2. Simplifies the creation and publishing of custom metrics to Amazon CloudWatch.
  3. Supports dimensions, namespaces, and multiple metrics in a single Lambda execution.

Example:

from aws_lambda_powertools.metrics import Metrics

metrics = Metrics(namespace="MyApplication", service="PaymentService")
metrics.add_metric(name="SuccessfulPayments", unit="Count", value=1)
metrics.publish()
  1. Tracing:
  2. Provides integration with AWS X-Ray for distributed tracing.
  3. Automatically traces Lambda handler execution and external calls like DynamoDB, S3, or HTTP requests.

Example:

from aws_lambda_powertools.tracing import Tracer

tracer = Tracer()

@tracer.capture_lambda_handler
def handler(event, context):
    # Traced code
    pass
  1. Validation:
  2. Helps validate input events using Pydantic models or JSON schemas.
  3. Reduces boilerplate and ensures robust input validation.

Example:

from aws_lambda_powertools.utilities.validation import validate
from schema import MY_EVENT_SCHEMA

@validate(event_schema=MY_EVENT_SCHEMA)
def handler(event, context):
    # Validated input
    pass
  1. Parameters:
  2. Simplifies the retrieval of parameters from AWS Systems Manager Parameter Store, AWS Secrets Manager, AWS AppConfig, Amazon DynamoDB, and custom providers.
  3. Supports caching and transforming parameter values (JSON and base64), improving performance and flexibility.

Example:

from aws_lambda_powertools.utilities.parameters import get_parameter

# Retrieve a parameter from AWS Secrets Manager
parameter = get_parameter(name="my-secret", provider="SecretsManager")

# Retrieve multiple parameters with caching
parameters = get_parameter(names=["param1", "param2"], cache=True)

# Retrieve and decode a base64 parameter
base64_param = get_parameter(name="my-base64-param", base64_decode=True)
  1. Event Source Data Classes:
  2. Provides self-describing classes for common Lambda event sources, helping with type hinting, code completion, and decoding nested fields.
  3. Simplifies working with event data by including docstrings for fields and providing helper functions for easy deserialization.

Example:

from aws_lambda_powertools.utilities.event_handler import event_source

# Event source for S3
from aws_lambda_powertools.utilities.event_source import S3Event

def handler(event, context):
    s3_event = S3Event(event)  # Type hinting and auto-completion

    # Access event fields with decoding/deserialization
    bucket_name = s3_event.records[0].s3.bucket.name
    object_key = s3_event.records[0].s3.object.key
    print(f"Bucket: {bucket_name}, Object Key: {object_key}")
  1. Parser (Pydantic):
  2. Simplifies data parsing and validation using Pydantic to define data models, parse Lambda event payloads, and extract only the needed data.
  3. Offers runtime type checking and user-friendly error messages for common AWS event sources.

Example:

from aws_lambda_powertools.utilities.parser import parse
from pydantic import BaseModel

# Define a data model using Pydantic
class MyEventModel(BaseModel):
    user_id: int
    user_name: str

@parse(model=MyEventModel)
def handler(event, context):
    # Access validated and parsed event data
    print(f"User ID: {event.user_id}, User Name: {event.user_name}")
  1. Other Utilities:
  2. Feature Flags: Manage runtime feature toggles using a configuration file or DynamoDB.
  3. Event Parser: Parse and validate common AWS event formats (e.g., DynamoDB, S3).

Why Use Lambda Powertools?

  1. Faster Development: Reduces boilerplate code, letting you focus on business logic.
  2. Best Practices Built-In: Aligns with AWS Well-Architected Framework, especially for observability.
  3. Improved Observability: Standardizes logs, metrics, and traces for better debugging and monitoring.
  4. Production-Ready: Simplifies common patterns required in serverless applications, making them easier to maintain.
  5. Extensibility: Modular design allows you to include only the features you need.

Summary

AWS Lambda Powertools for Python is like a Swiss Army Knife for serverless developers. It simplifies key operational tasks like logging, tracing, and metrics collection, ensuring best practices while improving developer productivity and code maintainability.

Managing Linux Dotfiles: A Guide to Customizing Your Environment

Introduction

Dotfiles are hidden configuration files in Unix-based systems (including Linux) that store settings for various applications and shell environments. They allow users to personalize their workflow, customize command-line tools, and manage configurations across multiple machines. In this post, we’ll explore what dotfiles are, why they’re important, and how to efficiently manage them for a seamless Linux experience.

Whether you’re new to dotfiles or looking for advanced techniques to manage them across multiple systems, this guide will cover everything you need to know.

Why using dotfiles

  • Productivity: Automate system and tool setup, saving time and effort when configuring new machines. Dotfiles instantly apply your preferred settings.

  • Consistency: Keep a uniform development environment across all devices, whether using macOS, Linux, or Windows, ensuring efficiency regardless of platform.

  • Shareable: Share your dotfiles with the community or use others' configurations, enabling collaboration and faster setup for new tools and languages.

  • Backup: Version control your dotfiles to back up and restore configurations easily, ensuring you can quickly recover your environment when needed.

dotfiles

https://github.com/mathiasbynens/dotfiles

https://github.com/holman/dotfiles

Conclusion

Dotfiles are powerful tools for personalizing and optimizing your Linux environment. By organizing and version-controlling them, you can ensure your workflow remains consistent across different machines. Start simple by creating your dotfiles, and as you become more comfortable, explore automation and symlink management for even greater efficiency.

Don’t forget to back up and share your dotfiles—it’s an excellent way to maintain consistency and collaborate with other developers!

Mi primer cluster

Me acuerdo el día que del cloud yo me enamoré
Mi viejo llegó sonriendo, me dijo que ya deployé
Le pedí otro cluster y le dije que el de kubear me lo sé
Me dijo: "De una, ingeniero, si no, ¿cómo vas a escalar?"
Si el cluster me llama, yo lo voy a escalar
Tú me conoces, yo no soy un novato
Firmé un commit en un repo de GitLab
Me apunté en un proyecto que aún no tiene backup
Sabes que yo deployo infra
Día y noche yo monitoreo
DevOps reconoce a DevOps
Sin Kubernetes nací y con Kubernetes me muero
Como mi jefe, de la nube al cielo
Tanta infra que gestioné, microservicios hay que optimizar
Oye, ¿cuándo cae mi bonus en el payroll?
Busco autoscaling
Día y noche yo deployeo
DevOps reconoce a DevOps
Sin Terraform nací y con Terraform me muero

Kube-bench: Automating Kubernetes Security Checks

What is it?

The Center for Internet Security (CIS) has established benchmarks to ensure the secure deployment of Kubernetes clusters. These benchmarks provide security configuration guidelines for Kubernetes, aiming to help organizations protect their environments from potential vulnerabilities.

One tool that automates this important process is kube-bench. It runs checks against your Kubernetes cluster based on the CIS Kubernetes Benchmark, helping to verify whether your cluster is configured securely.

Why Use Kube-bench?

kube-bench streamlines security auditing by automating the verification of your Kubernetes setup. It checks for best practices, identifies misconfigurations, and reports areas where your setup might fall short of CIS recommendations. This makes it easier to maintain compliance and reduce the risk of exposure to security threats.

Whether you're running Kubernetes in production, or setting up a development cluster, regular use of kube-bench helps ensure that your deployments meet security standards.

For more details and to start using kube-bench, visit the official GitHub repository.

Running kube-bench on Kubernetes Clusters

The kube-bench tool can be executed in various ways depending on your Kubernetes cluster setup. It ensures that your Kubernetes deployment aligns with the CIS Kubernetes Benchmark, which provides security guidelines.

In this blog, I’ll share how I used kube-bench to audit both worker and master nodes of a Kubernetes cluster deployed with kOps on AWS.

Worker Node Auditing

To audit the worker nodes, I submitted a Kubernetes job that runs kube-bench specifically for worker node configuration. Below are the steps:

# Download the worker node job configuration
$ curl -O https://raw.githubusercontent.com/aquasecurity/kube-bench/main/job.yaml

$ kubectl apply -f job.yaml
job.batch/kube-bench created

$ kubectl get pods
NAME                      READY   STATUS              RESTARTS   AGE
kube-bench-j76s9   0/1     ContainerCreating   0          3s

# Wait for a few seconds for the job to complete
$ kubectl get pods
NAME                      READY   STATUS      RESTARTS   AGE
kube-bench-j76s9   0/1     Completed   0          11s

# The results are held in the pod's logs
kubectl logs kube-bench-j76s9
[INFO] 4 Worker Node Security Configuration
[INFO] 4.1 Worker Node Configuration Files
...

The logs will contain a detailed list of recommendations, outlining the identified security issues and how to address them. You can see an example of the full output in this Gist.

Within the output, each problematic area is explained, and kube-bench offers solutions for improving security on the worker nodes.

Master Node Auditing

To audit the master nodes (control plane), I used a script specifically designed for the master node configuration. Follow these steps to run the audit:

# Download the master node job configuration
$ curl -O https://raw.githubusercontent.com/aquasecurity/kube-bench/main/job-master.yaml

$ kubectl apply -f job-master.yaml
job.batch/kube-bench created

$ kubectl get pods
NAME                      READY   STATUS              RESTARTS   AGE
kube-bench-xxxxx   0/1     ContainerCreating   0          3s

# Wait for a few seconds for the job to complete
$ kubectl get pods
NAME                      READY   STATUS      RESTARTS   AGE
kube-bench-xxxxx   0/1     Completed   0          11s

# The results are held in the pod's logs
kubectl logs kube-bench-j76s9
[INFO] 1 Control Plane Security Configuration
[INFO] 1.1 Control Plane Node Configuration Files
...

The logs will contain a detailed list of recommendations, outlining the identified security issues and how to address them. You can see an example of the full output in this Gist.

kubesec Static analysis security scanning tool.

The problem

Kubernetes resources can be vulnerable to misconfigurations, leading to security risks in your infrastructure. Detecting these issues early is critical to maintaining a secure environment.

What is ?

Is an open-source tool that performs static analysis on Kubernetes resources, identifying security risks before deployment. It ensures that your Kubernetes configuration adheres to best security practices.

How to usage kubesec

There are several ways to use kubesec to scan your Kubernetes resources:

  • Docker container image: docker.io/kubesec/kubesec:v2
  • Linux/MacOS/Win binary (get the latest release)
  • Kubernetes Admission Controller
  • Kubectl plugin

Using the Docker Image

The simplest way to run kubesec is by using its Docker image and passing the file you want to scan. For example, to check the app1-510d6362.yaml file:

docker run -i kubesec/kubesec:512c5e0 scan /dev/stdin < app1-510d6362.yaml

This command runs a scan on the specified file, producing results like this:

[
  {
    "object": "Pod/pod.default",
    "valid": true,
    "message": "Passed with a score of 0 points",
    "score": 0,
    "scoring": {
      "advise": [
        {
          "selector": "containers[] .securityContext .readOnlyRootFilesystem == true",
          "reason": "An immutable root filesystem can prevent malicious binaries being added to PATH and increase attack cost"
        },
        {
          "selector": "containers[] .securityContext .runAsNonRoot == true",
          "reason": "Force the running image to run as a non-root user to ensure least privilege"
        },
        {
          "selector": "containers[] .securityContext .runAsUser -gt 10000",
          "reason": "Run as a high-UID user to avoid conflicts with the host's user table"
        },
        {
          "selector": "containers[] .securityContext .capabilities .drop",
          "reason": "Reducing kernel capabilities available to a container limits its attack surface"
        },
        {
          "selector": "containers[] .securityContext .capabilities .drop | index(\"ALL\")",
          "reason": "Drop all capabilities and add only those required to reduce syscall attack surface"
        },
        {
          "selector": "containers[] .resources .requests .cpu",
          "reason": "Enforcing CPU requests aids a fair balancing of resources across the cluster"
        },
        {
          "selector": "containers[] .resources .limits .cpu",
          "reason": "Enforcing CPU limits prevents DOS via resource exhaustion"
        },
        {
          "selector": "containers[] .resources .requests .memory",
          "reason": "Enforcing memory requests aids a fair balancing of resources across the cluster"
        },
        {
          "selector": "containers[] .resources .limits .memory",
          "reason": "Enforcing memory limits prevents DOS via resource exhaustion"
        },
        {
          "selector": ".spec .serviceAccountName",
          "reason": "Service accounts restrict Kubernetes API access and should be configured with least privilege"
        },
        {
          "selector": ".metadata .annotations .\"container.seccomp.security.alpha.kubernetes.io/pod\"",
          "reason": "Seccomp profiles set minimum privilege and secure against unknown threats"
        },
        {
          "selector": ".metadata .annotations .\"container.apparmor.security.beta.kubernetes.io/nginx\"",
          "reason": "Well defined AppArmor policies may provide greater protection from unknown threats. WARNING: NOT PRODUCTION READY"
        }
      ]
    }
  }
]

terraform-docs: A Cool Way of Documenting Terraform Projects

What Is It?

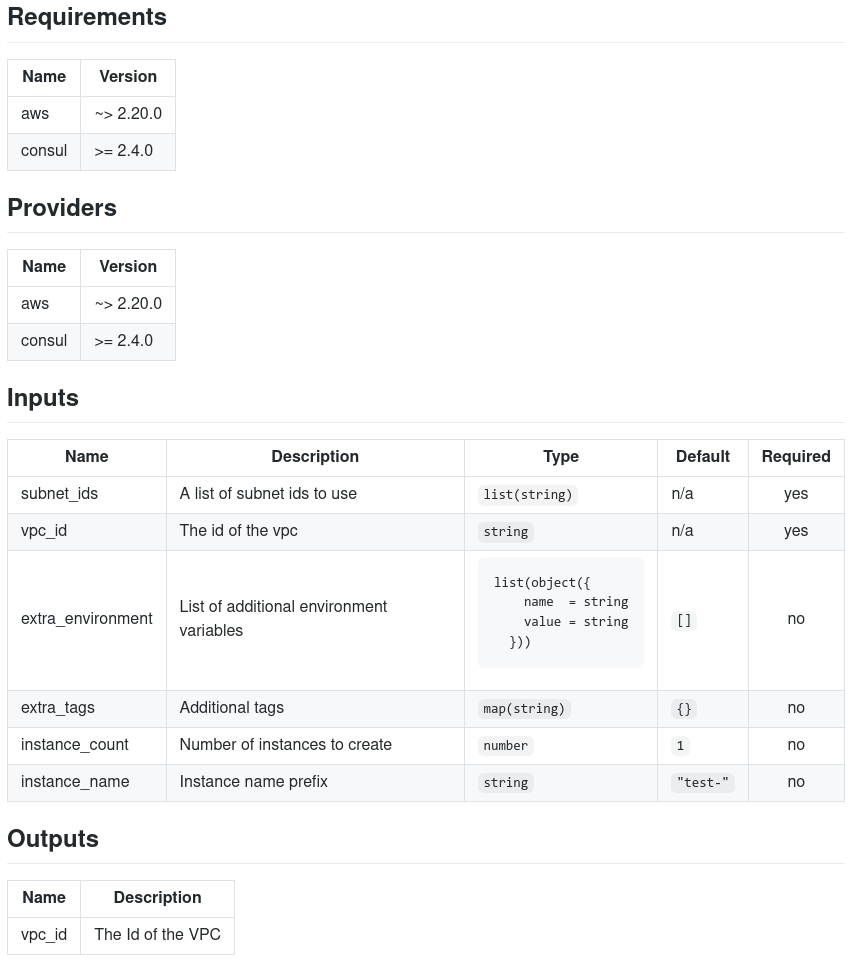
terraform-docs is a utility that generates documentation from Terraform modules in various output formats. It allows you to easily integrate documentation that displays inputs, outputs, requirements, providers, and more! It supports several output formats—my personal favorite is Markdown.

What Does It Look Like?

An example from the official documentation provides a clear illustration of how the module works, making it much easier for users to understand its usage. Below is an image demonstrating this example.

Markdown Table Output
Screenshot of a markdown table generated by `terraform-docs`.

Installation

As the installation process may change over time, please refer to the official documentation.

Options

You need to define a .config directory inside the directory where you want to generate the documentation. In this file, we define:

  • formatter: Set to Markdown, which I recommend.
  • output: Set to README.md, which is the default file for displaying content in a repository.
  • sort: To enable sorting of elements. We use the required criteria that sorts inputs by name and shows required ones first.
  • settings: General settings to control the behavior and the generated output.
  • content: The specific content to include in the documentation.

Minimal Configuration

formatter: "markdown"

output:
  file: "README.md"

sort:
  enabled: true
  by: required

settings:
  read-comments: false
  hide-empty: true
  escape: false

content: |-
  {{ .Requirements }}

  {{ .Modules }}

  {{ .Inputs }}

  {{ .Outputs }}

For more details about the configuration, please refer to this guide

Integration with Github Actions

To use terraform-docs with GitHub Actions, configure a YAML workflow file (e.g., .github/workflows/documentation.yml) with the following content:

name: Generate terraform docs

on:
  pull_request:
    branches:
      - main

jobs:
  terraform:
    name: "terraform docs"
    runs-on: ubuntu-latest

    # Use the Bash shell regardless whether the GitHub Actions runner is ubuntu-latest, macos-latest, or windows-latest
    defaults:
      run:
        shell: bash

    steps:
      # Checkout the repository to the GitHub Actions runner
      - name: Checkout
        uses: actions/checkout@v2

      # Install the latest version of Terraform CLI
      - name: Check docs
        uses: terraform-docs/gh-actions@v1.0.0
        with:
          output-file: README.md
          fail-on-diff: true

See it in action

Here's an example of terraform-docs being used in a personal module I developed.

Terragrunt Raise the DRY flag

If you're familiar with Infrastructure as Code (IaC) tools, this post is for you. The goal here is to introduce you to Terragrunt, a tool that enables you to follow the DRY (Don't Repeat Yourself) principle, making your Terraform code more maintainable and concise.

What it is?

Terragrunt is a flexible orchestration tool designed to scale Infrastructure as Code, making it easier to manage Terraform configurations across multiple environments.

Let's present the problem.

Keep your backend configuration DRY

Before diving into Terragrunt, let's first define the problem it solves. Consider the following Terraform project structure:

#./terraform/
.
├── envs
│   ├── dev
│   │   ├── backend.tf
│   │   └── main.tf
│   ├── prod
│   │   ├── backend.tf
│   │   └── main.tf
│   └── stage
│       ├── backend.tf
│       └── main.tf
└── modules
    └── foundational
        └── main.tf

In this scenario, we have a foundational module, with separate environments for dev, stage, and prod. As the complexity of the system grows, maintaining repeated backend configurations becomes more challenging.

Take, for example, the following backend configuration for the dev environment:

# ./terraform/envs/dev/backend.tf
terraform {
  backend "s3" {
    bucket         = "my-terraform-state"
    key            = "envs/dev/bakcend/terraform.tfstate"
    region         = "us-east-1"
    encrypt        = true
    dynamodb_table = "my-lock-table"
  }
}

This configuration is required for each environment (dev, stage, prod), and you'll find yourself copying the same code across all of them. This approach isn't scalable and quickly becomes difficult to maintain.

Now, let's see how Terragrunt simplifies this.

Introducing Terragrunt

With Terragrunt, you can move repetitive backend configurations into a single file and reuse them across all environments.

Here's how your updated directory structure looks:

# ./terraform/
.
├── envs
│   ├── dev
│   │   ├── backend.tf
│   │   ├── main.tf
│   │   └──terragrunt.hcl
│   ├── prod
│   │   ├── backend.tf
│   │   ├── main.tf
│   │   └── terragrunt.hcl
│   ├── stage
│   │   ├── backend.tf
│   │   ├── main.tf
│   │   └── terragrunt.hcl
└── terragrunt.hcl

The terragrunt.hcl file uses the same HCL language as Terraform and centralizes the backend configuration. Instead of duplicating code, we now use Terragrunt’s path_relative_to_include() function to dynamically set the backend key for each environment.

Here’s what that looks like:

#./terraform/envs/terragrunt.hcl
remote_state {
  backend = "s3"
  generate = {
    path      = "backend.tf"
    if_exists = "overwrite_terragrunt"
  }
  config = {
    bucket = "my-terraform-state"

    key = "${path_relative_to_include()}/terraform.tfstate"
    region         = "us-east-1"
    encrypt        = true
    dynamodb_table = "my-lock-table"
  }
}

By centralizing this, you only need to update the root terragrunt.hcl to apply changes across all environments.

Including root configuration

You can include the root configuration in each child environment by referencing the root terragrunt.hcl file like this:

#./terraform/env/stage/terragrunt.hcl
include "root" {
  path = find_in_parent_folders()
}

This drastically reduces duplication and keeps your backend configurations DRY.

Keep your provider configuration DRY

One common challenge in managing Terraform configurations is dealing with repetitive provider blocks. For example, when you're configuring AWS provider roles, you often end up with the same block of code repeated across multiple modules:

# ./terraform/env/stage/main.tf
provider "aws" {
  assume_role {
    role_arn = "arn:aws:iam::0123456789:role/terragrunt"
  }
}

To avoid copy-pasting this configuration in every module, you can introduce Terraform variables:

# ./terraform/env/stage/main.tf
variable "assume_role_arn" {
  description = "Role to assume for AWS API calls"
}

provider "aws" {
  assume_role {
    role_arn = var.assume_role_arn
  }
}

This approach works fine initially, but as your infrastructure grows, maintaining this configuration across many modules can become tedious. For instance, if you need to update the configuration (e.g., adding a session_name parameter), you would have to modify every module where the provider is defined.

Simplify with Terragrunt

Terragrunt offers a solution to this problem by allowing you to centralize common Terraform configurations. Like with backend configurations, you can define the provider configuration once and reuse it across multiple modules. Using Terragrunt’s generate block, you can automate the creation of provider configurations for each environment.

Here’s how it works:

#./terraform/env/stage/terragrunt.hcl
generate "provider" {
  path = "provider.tf"
  if_exists = "overwrite_terragrunt"
  contents = <<EOF
provider "aws" {
  assume_role {
    role_arn = "arn:aws:iam::0123456789:role/terragrunt"
  }
}
EOF
}

This generate block tells Terragrunt to create a provider.tf file in the working directory (where Terragrunt calls Terraform). The provider.tf file is generated with the necessary AWS provider configuration, meaning you no longer need to manually define this in every module.

When you run a Terragrunt command like terragrunt plan or terragrunt apply, it will generate the provider.tf file in the local .terragrunt-cache directory for each module

$ cd /terraform/env/stage/
$ terragrunt apply
$ find . -name "provider.tf"
.terragrunt-cache/some-unique-hash/provider.tf

This approach ensures that your provider configuration is consistent and automatically injected into all relevant modules, saving you time and effort while keeping your code DRY.

By centralizing provider configurations with Terragrunt, you reduce the risk of errors from manual updates and ensure that any changes to provider settings are automatically applied across all modules.

Installation

For installation instructions, please refer to the official documentation